Financial Highlights
Continuing Operations
GAAP Measures
(in millions, except per share data) 2021 2022 2023
Revenue 2,241.4 2,315.3 2,826.0
Gross Profit 732.3 763.8 948.2
Gross Profit Margin 32.7 33.0 33.6
Net Income 122.7 109.4 107.1
Diluted EPS 1.63 1.51 1.53
Operating Cash Flow 362.7 63.3 207.0
Capital Expenditures 28.2 38.3 69.3
Dividends Per Share 0.86 0.87 0.88
NON-GAAP & OTHER OPERATING MEASURES
(in millions, except per share data) (See supplemental page included for a reconciliation of non-GAAP measures to the most directly comparable GAAP measures) 2021 2022 2023
Organic Revenue 2,173.3 2,312.9 2,408.5
Adjusted EBITDA 378.7 401.5 483.2
Organic Adjusted EBITDA 374.4 401.5 418.3
Adjusted Diluted EPS 2.10 2.69 3.52
Total Backlog 1,715.0 1,762.0 2,099.6
Adjusted EBITDA
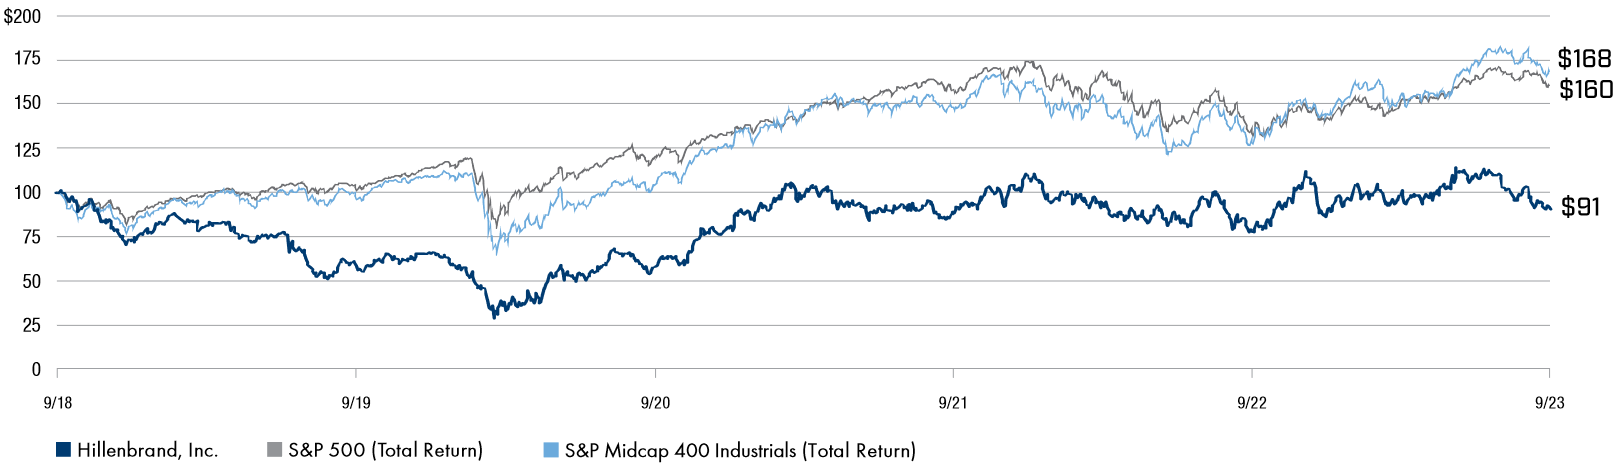
Value of $100 Investment on September 30, 2018