
We Delivered Record Financial Performance in 2021.
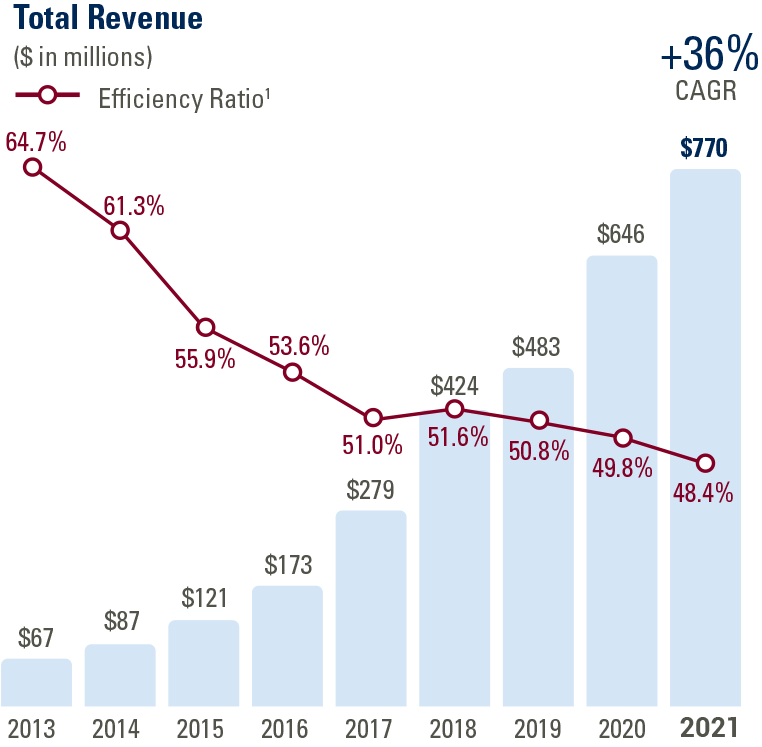
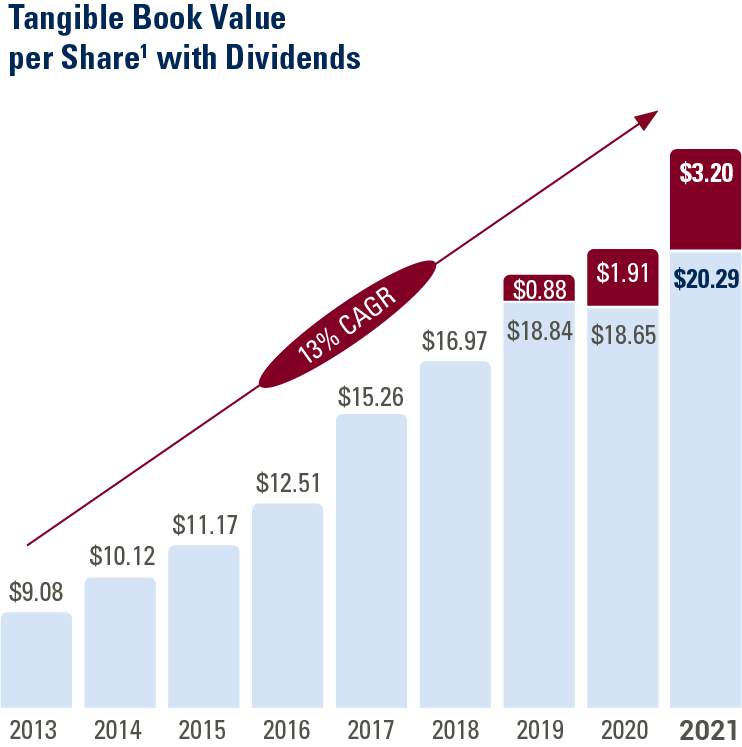
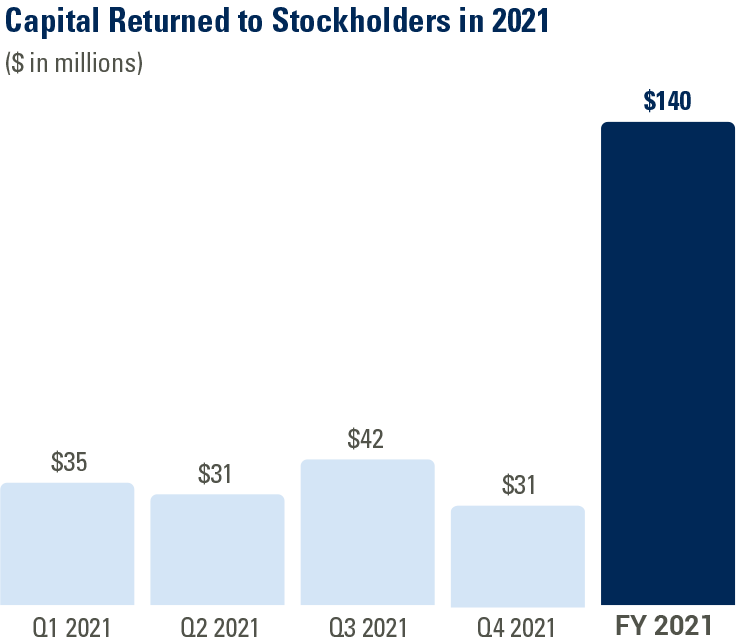
During 2021, our team produced solid results as net income was a record $340 million, driven by a 19% increase in total revenue, which totaled $770 million. The record level of total revenue and continued improvement in our efficiency ratio was a direct result of our ability to gain scale and quickly realize synergies through successfully executing our acquisition strategy. Throughout the year, we continued to drive stockholder value as tangible book value per share increased 9% from 2020. Additionally, we returned $140 million in capital to our stockholders during 2021, which included a 10% increase in our quarterly dividend to $0.33 per share in the second quarter of 2021.
1 A reconciliation of the non-GAAP measures of tangible book value per share and efficiency ratio derived from GAAP measures are set forth in the “Non-GAAP Reconciliation” section included herein.
Non-GAAP Reconciliations
Tangible Book Value per Share
| For the Year Ended December 31, | |||||||||
| (Dollars in thousands, except per share data) | 2013 | 2014 | 2015 | 2016 | 2017 | 2018 | 2019 | 2020 | 2021 |
|---|---|---|---|---|---|---|---|---|---|
| Total stockholders' equity | $175,226 | $199,592 | $298,980 | $459,740 | $1,241,996 | $1,969,697 | $2,012,594 | $2,746,649 | $2,886,311 |
| Less: intangible assets | (24,056) | (28,564) | (58,002) | (111,941) | (536,343) | (909,282) | (891,634) | (984,076) | (970,883) |
| Tangible common equity | $151,170 | $171,028 | $240,978 | $347,799 | $705,653 | $1,060,415 | $1,120,960 | $1,762,573 | $1,915,428 |
| Basic shares outstanding | 16,656,279 | 16,903,884 | 21,570,746 | 27,798,283 | 46,245,050 | 62,480,755 | 59,506,057 | 94,483,136 | 94,389,543 |
| Book value per share | $10.52 | $11.81 | $13.86 | $16.54 | $26.86 | $31.52 | $33.82 | $29.07 | $30.58 |
| Less: intangible book value per share | (1.44) | (1.69) | (2.69) | (4.03) | (11.60) | (14.55) | (14.98) | (10.42) | (10.29) |
| Tangible book value per share | $9.08 | $10.12 | $11.17 | $12.51 | $15.26 | $16.97 | $18.84 | $18.65 | $20.29 |
Efficiency Ratio
| For the Year Ended December 31, | |||||||||
| (Dollars in thousands) | 2013 | 2014 | 2015 | 2016 | 2017 | 2018 | 2019 | 2020 | 2021 |
| Total noninterest expense | $50,815 | $54,938 | $73,332 | $98,063 | $167,958 | $249,905 | $259,065 | $381,119 | $380,277 |
| Less: amortization of intangible assets | (764) | (1,014) | (1,350) | (2,039) | (6,144) | (13,594) | (17,245) | (17,072) | (15,936) |
| Less: other real estate owned operations, net | (618) | (75) | (121) | (385) | (72) | (4) | (160) | (1) | --- |
| Less: merger-related expense | (6,926) | (1,490) | (4,799) | (4,388) | (21,002) | (18,454) | (656) | (49,129) | (5) |
| Noninterest expense, adjusted | $42,507 | $52,359 | $67,062 | $91,251 | $140,740 | $217,853 | $241,004 | $314,917 | $364,336 |
| Net interest income before provision for loan losses | $58,444 | $73,635 | $106,299 | $153,075 | $247,502 | $392,711 | $447,301 | $574,211 | $662,374 |
| Add: total noninterest income | 8,811 | 13,377 | 14,388 | 19,602 | 31,114 | 31,027 | 35,236 | 71,325 | 107,850 |
| Less: net gain from investment securities | (1,544) | (1,547) | (290) | (1,797) | (2,737) | (1,399) | (8,571) | (13,882) | (16,906) |
| Less OTTI impairment - securities | 4 | 29 | - | 205 | (1) | (4) | (2) | (2) | (10) |
| Less: net (gain) loss from other real estate owned | - | - | - | (18) | (46) | (281) | (52) | 112 | --- |
| Less: net loss from debt extinguishment | - | - | - | - | - | - | 612 | - | 180 |
| Revenue, adjusted | $65,715 | $85,494 | $120,397 | $171,067 | $275,832 | $422,054 | $474,524 | $631,764 | $753,488 |
| Efficiency Ratio | 64.7% | 61.3% | 55.9% | 53.6% | 51.0% | 51.6% | 50.8% | 49.8% | 48.4% |